NEW
Booking data, wherever you need it:

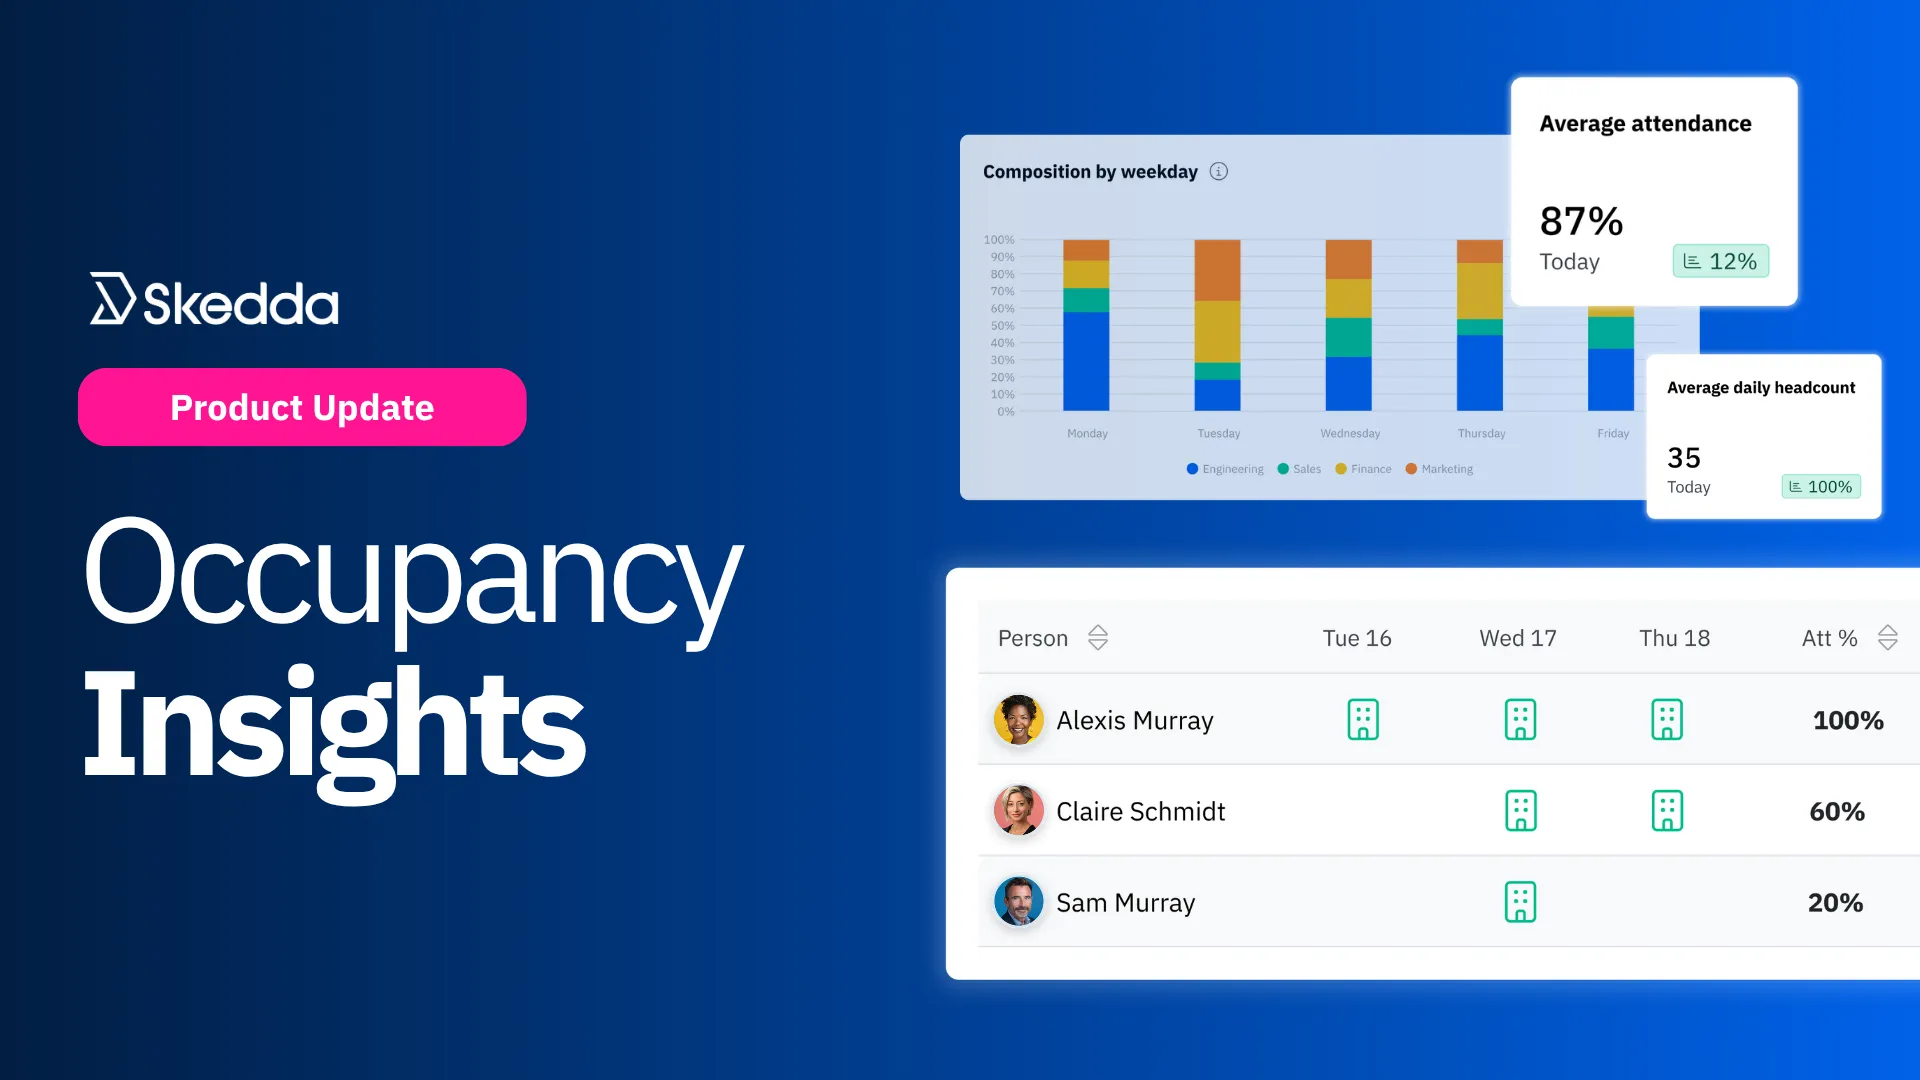
Presence data, put to work. With Skedda's new Occupancy Insights dashboard, you get:
If you're running a hybrid office, you've probably noticed the gap. Someone books a desk and never shows up. Someone else walks in without booking anything at all. Utilization numbers look healthy, but they're built on what people reserved, not what actually happened.
That gap becomes a real problem the moment you need an honest answer. How many people are in the building right now? Is your return-to-office policy actually being followed, or just written down somewhere? Which teams overlap on which days? Booking history can't answer any of that on its own.
That's the gap Skedda’s Occupancy Tracking closes. It passively confirms someone was on-site by matching their device to your office network, through our Companion App, our mobile app, or simple browser activity, with no badge and no extra step for your team. Up until now, though, that data lived quietly in the background, confirming individual check-ins but never adding up to a usable picture.
Occupancy Insights is the reporting layer that finally surfaces this attendance data in an actionable dashboard. And we are very excited about it.
Presence data matters for two very different reasons, and Occupancy Insights was built around both.
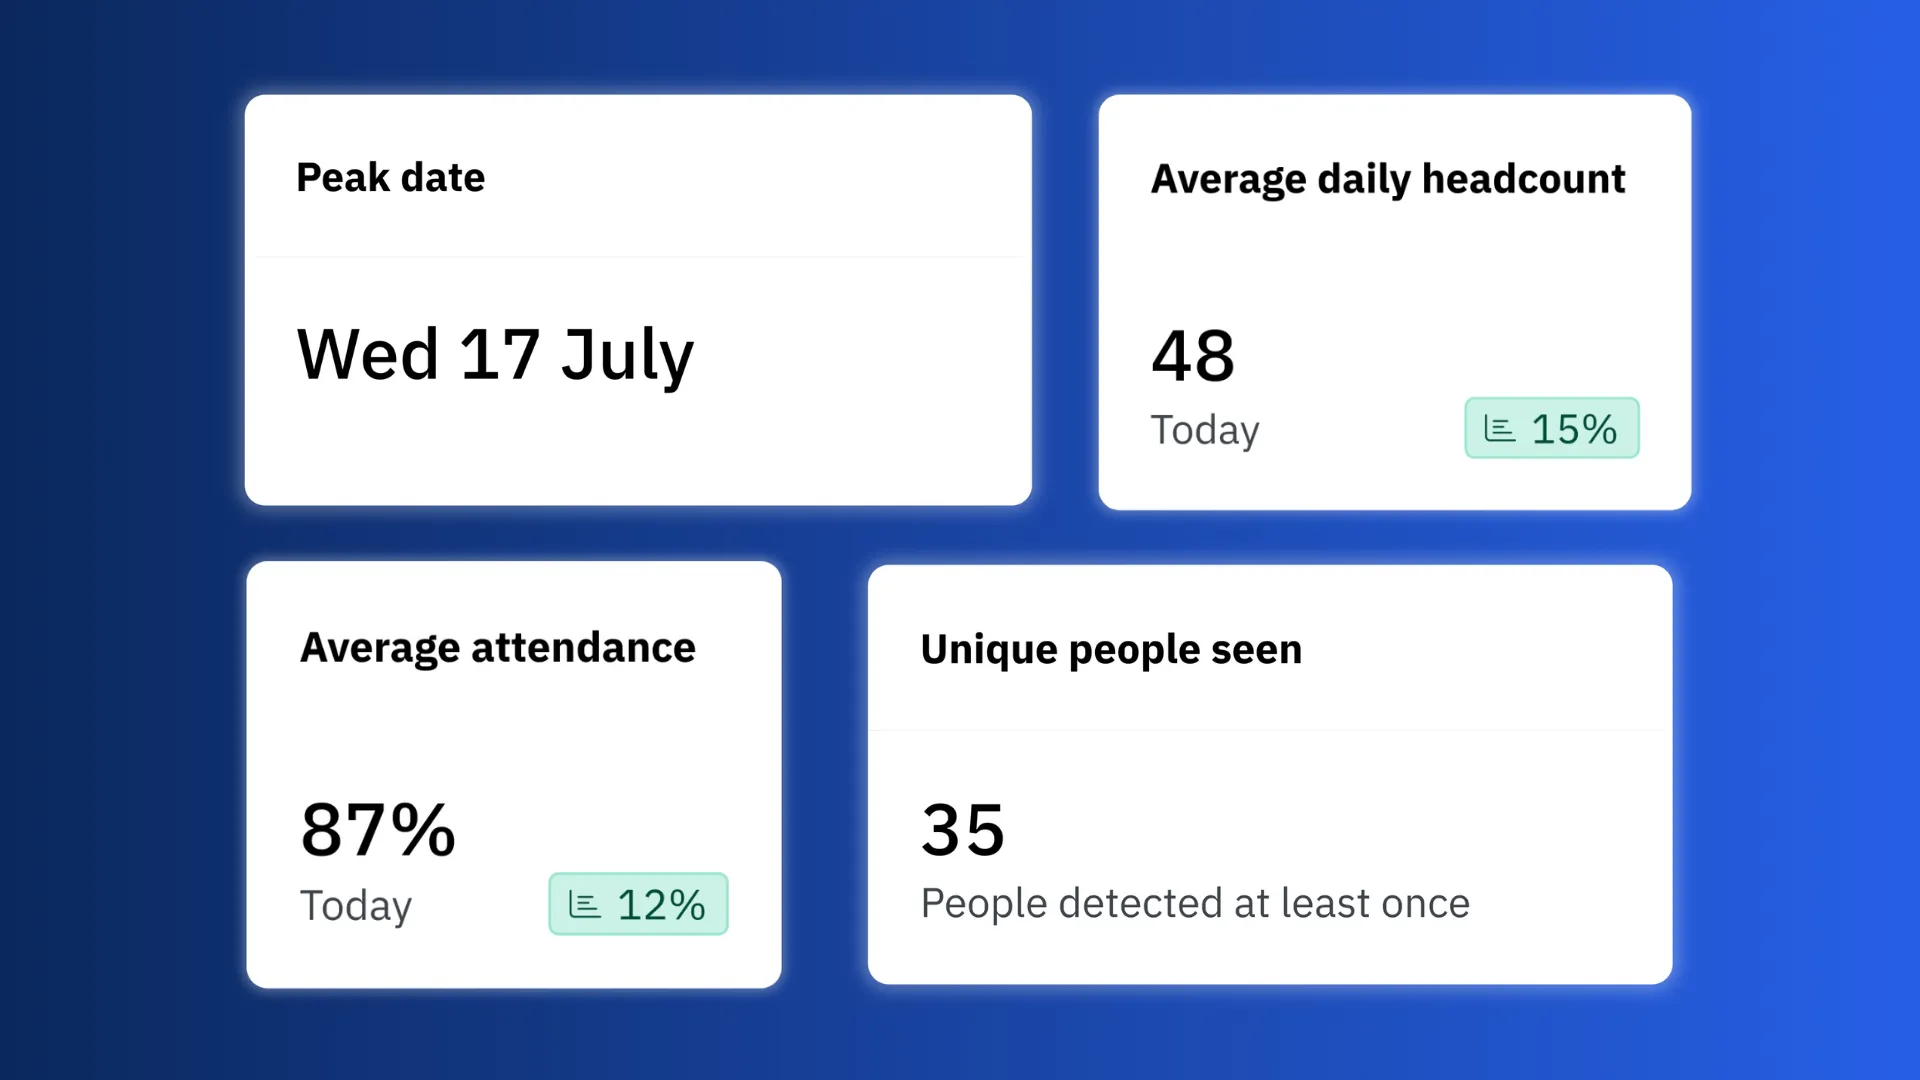
The first is headcount and safety. From an operational standpoint, not knowing how many people are actually in your building day-to-day is more than an inconvenience; it's a risk. If there's a fire drill, a severe weather closure, or you're just trying to staff the front desk appropriately, you need an actual headcount, not an estimate based on reservations. Booking volume rarely matches actual presence. People book multiple spaces, skip bookings they did make, and show up without booking anything at all. That's what the headline KPIs are there for: average daily headcount, unique people seen, and your peak day, all filterable by date range so you're looking at exactly the window that matters, whether that's today or the last quarter.
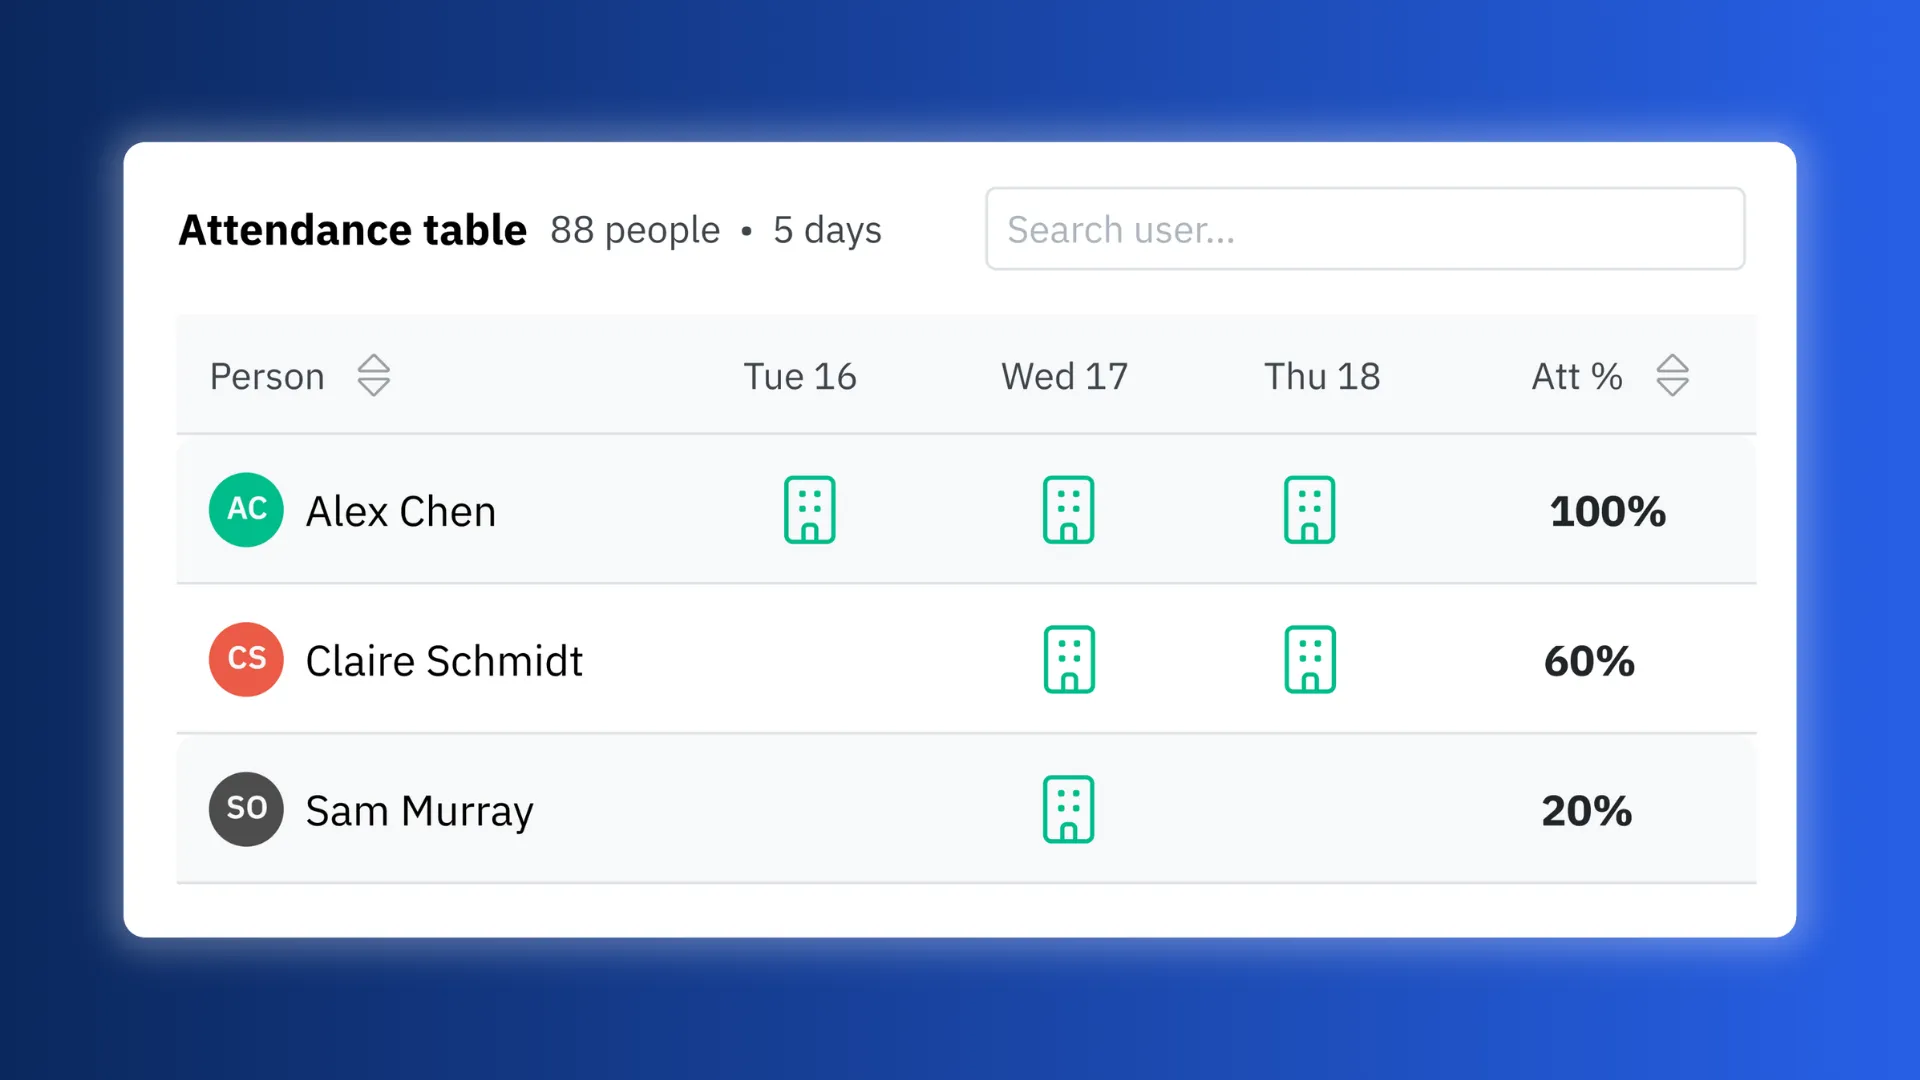
The second is RTO and attendance accountability. A return-to-office policy is only as good as your ability to see who's following it, and utilization reports can't do that job. They tell you what’s being reserved, not who is physically on-site. Occupancy Insights surfaces per-person, per-team attendance percentages, filterable by user tag so you can isolate a single department or compare across the whole org, and exportable straight from the attendance table in one click.
Both of these rest on the same underlying idea: presence data, once visualized, does far more than confirm who used a desk.
Here’s what Skedda’s Occupancy Insights dashboard gives you:
Headcount KPIs
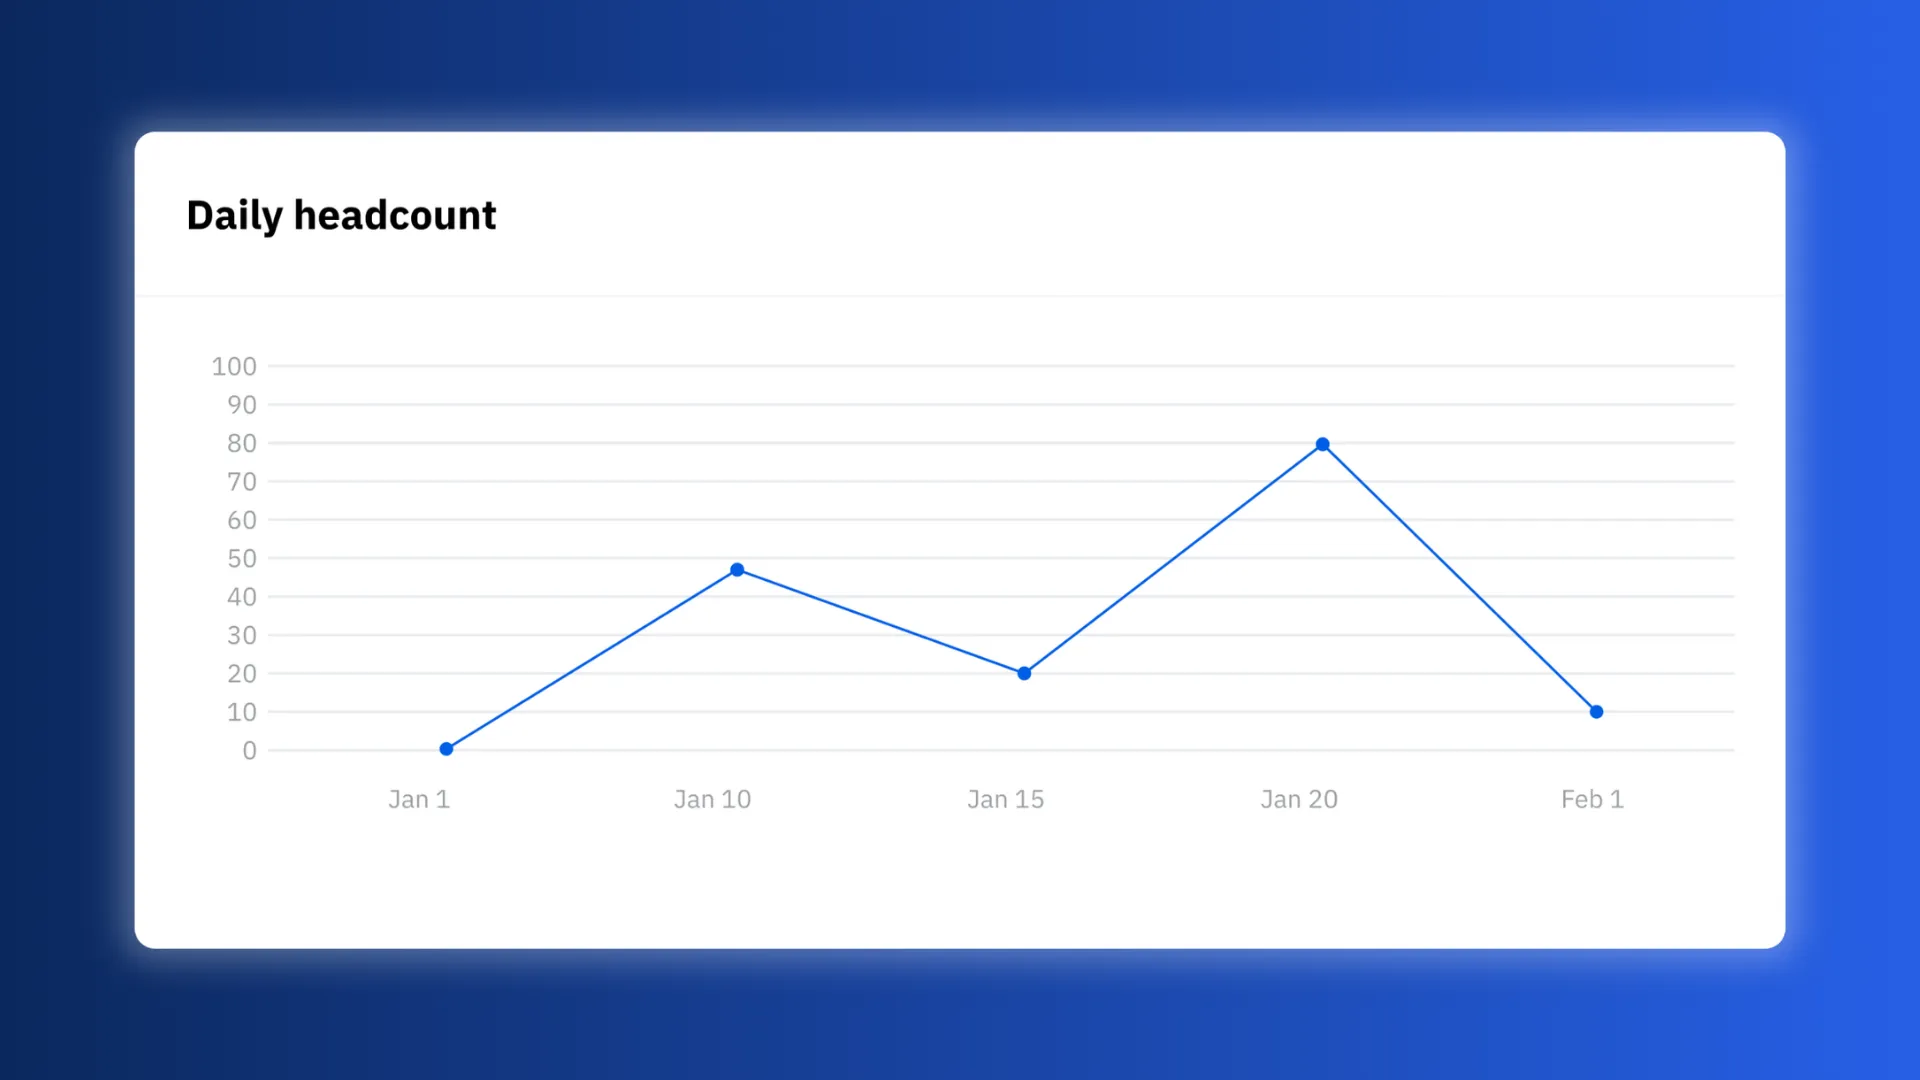
Attendance & Composition Reports
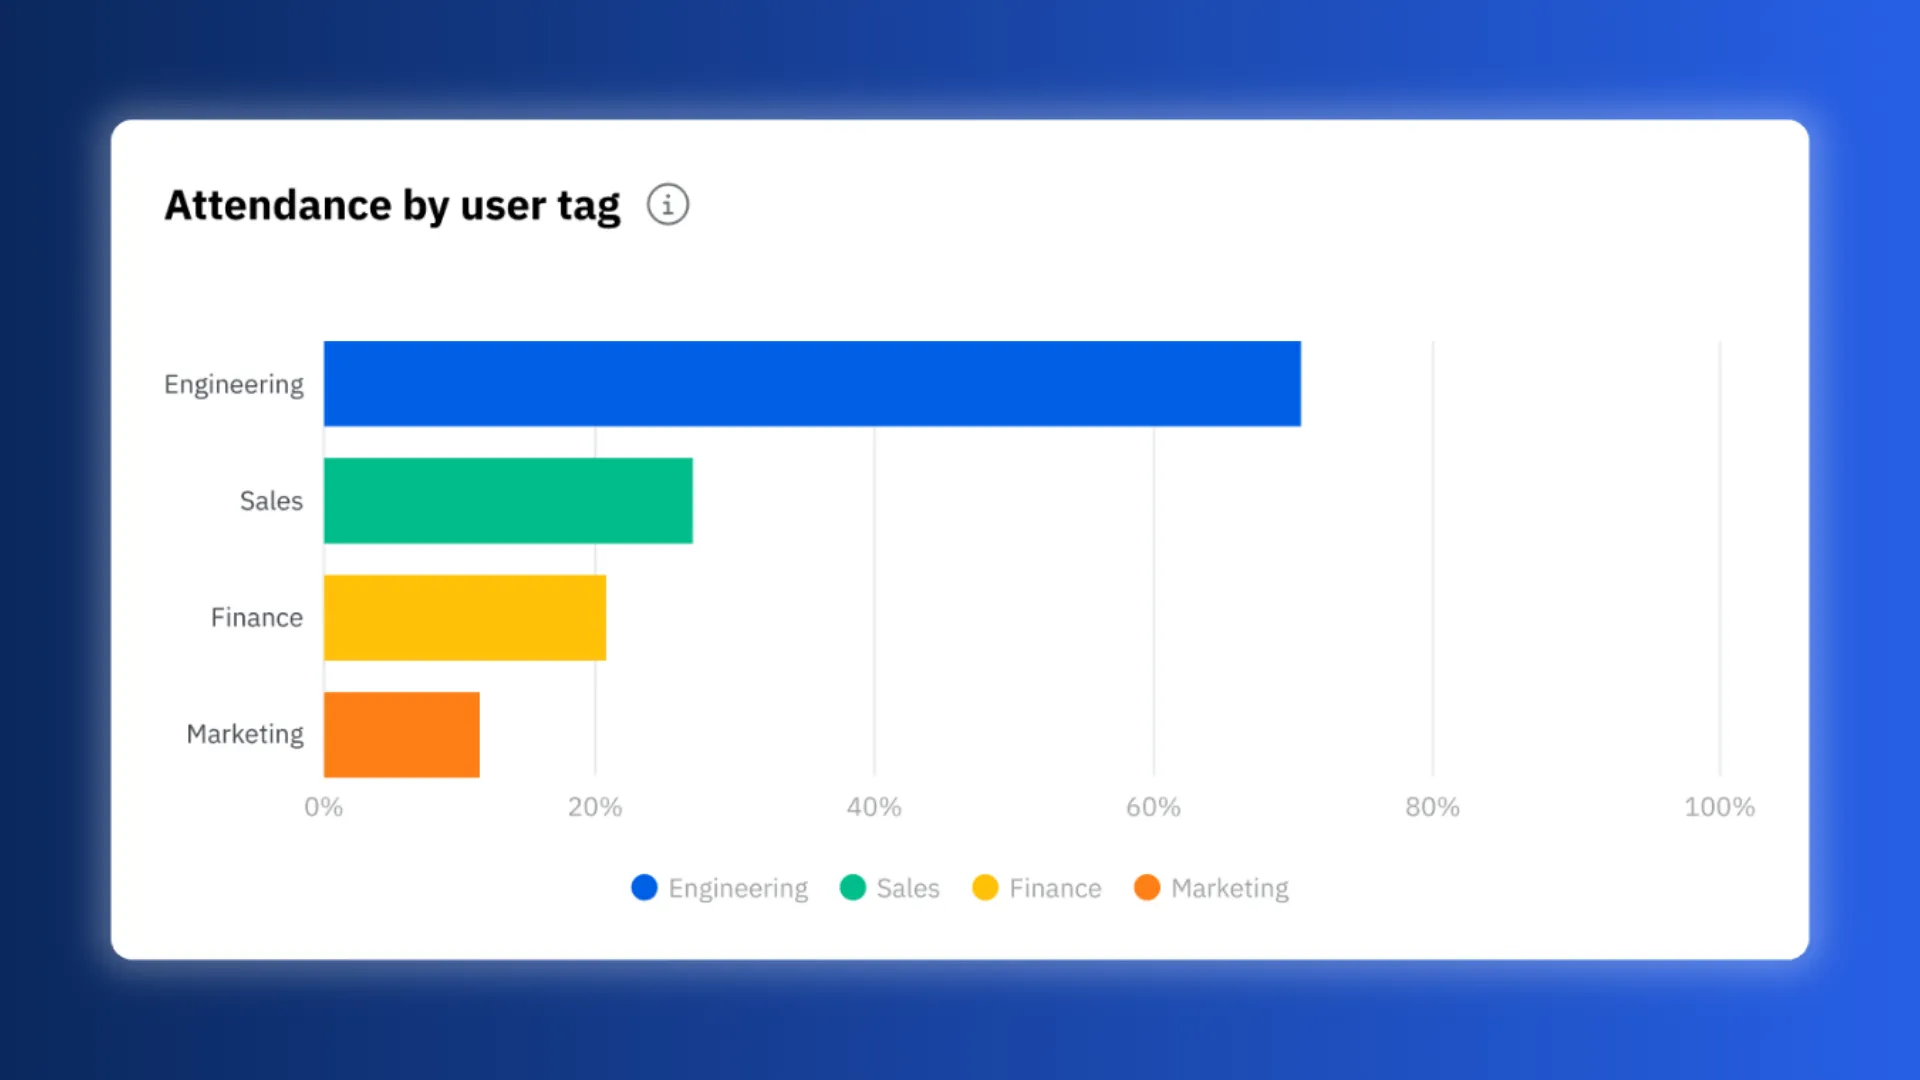
Using Occupancy Insights in your Skedda account takes a couple of steps:
To learn more about Occupancy Insights, check out the help guide.
Utilization tells you what people planned to do in your office. Occupancy Insights tells you who's actually showing up. Together, they're the full picture of how your office is really used. Whether you're managing RTO more effectively, optimizing your footprint, or simply keeping a finger on the pulse of daily headcount, that picture starts here.
If you're already tracking presence, log into Insights and check the Occupancy tab today. If you're not, this is a good time to get started.
Ready to see it in action? Book a demo with our team today.
Our team is ready and waiting to talk through your specific desk scheduling requirements and see how Skedda could work for you.

.svg)