NEW:
Manage all your offices in one dashboard with the Organization Hub.

Space management software has matured into a well-defined category, but the platforms inside it solve meaningfully different problems. They split along pricing model and scope:
Space management chaos tends to hit at the worst times. Like on your busiest office days, when there are more people than desks, and meeting rooms are harder to book than Bruce Springsteen tickets.
This is space management without the right tools. Not a space problem. A governance, visibility, and adoption problem. Every organization running a hybrid office eventually hits this wall. The good news: it’s solvable, and the software category that solves it has matured.
This guide evaluates 13 platforms against the criteria that actually matter for workplace and facilities teams managing hybrid environments: booking rules depth, pricing model transparency, integration quality, and ease of rollout. Read straight through or jump to the comparison table to shortlist first.
The 13 best space management platforms for 2026, ranked. Skedda (the publisher of this guide) is placed #1 against the criteria below; platforms #2–#6 are ordered by their public G2 ratings, and the remaining platforms follow. Jump to any review for the full breakdown.
Skedda publishes this guide. We’re a space management platform used by 8,000+ organizations and 3M+ users, which means we know this category from the inside — but it also means we have an obvious conflict of interest. Here is how we manage it, transparently: we rank every platform against the same criteria — booking rules and governance depth, pricing-model transparency, integration quality, interactive floor plans, utilization analytics, and ease of rollout. Skedda ranks #1 on these criteria for its target mid-market buyer, and we make that case openly rather than hiding it. Platforms #2–#6 are ordered by their publicly available G2 ratings; the remaining platforms, which don’t carry a comparable public G2 score, follow. We’ve included Skedda’s genuine limitations in its cons section, and every competitor review is written independently. Reweight the criteria below to match your organization’s priorities.
Ratings and pricing reflect publicly available data as of April 2026. Verify current figures with vendors before purchasing.
G2 ratings are approximate as of April 2026 and shown where a comparable public score is available; “—” indicates no comparable public G2 score at time of writing. Review counts vary; verify at g2.com before making decisions.
Space management software is the operational layer that governs how shared physical spaces (desks, meeting rooms, parking spots, labs, collaboration zones) get booked, assigned, and measured across an organization.
At its core, the category solves three connected problems: employees can’t find available space, facilities and admin teams spend too many hours managing manual requests, and leadership makes expensive real estate decisions based on anecdote rather than data. According to JLL’s research, global office utilization averages between 50–65% in hybrid environments, meaning most organizations are paying for space that isn’t being used with no systematic way to know which.
Room booking software handles conference room scheduling. Space management software does that and more: it governs desks, manages hybrid policies (who can book what, when, under what rules), tracks utilization across all space types, and provides the analytics leaders need to rightsize their real estate footprint. The line between the two categories has blurred as room booking tools have grown into broader platforms, but the meaningful distinction remains: does the platform govern policy and measure utilization, or just let people reserve rooms?
When your team has grown past the point where “just ask someone” or “check the spreadsheet” works. The tipping point is usually when you’re running a hybrid schedule, have more employees than desks, or have started fielding complaints about space fairness (the same people always getting the best rooms, certain teams hoarding desks). Software doesn’t solve culture problems, but it does enforce policy automatically so you don’t have to.
Booking rules and governance depth. This is the feature that separates serious platforms from lightweight booking widgets. Look for: booking windows (how far in advance anyone can reserve), buffer times between bookings, per-user or per-group quotas, eligibility rules (certain spaces reserved for certain teams), and approval workflows. Not every organization needs all of these, but you want the depth available for when policy evolves.
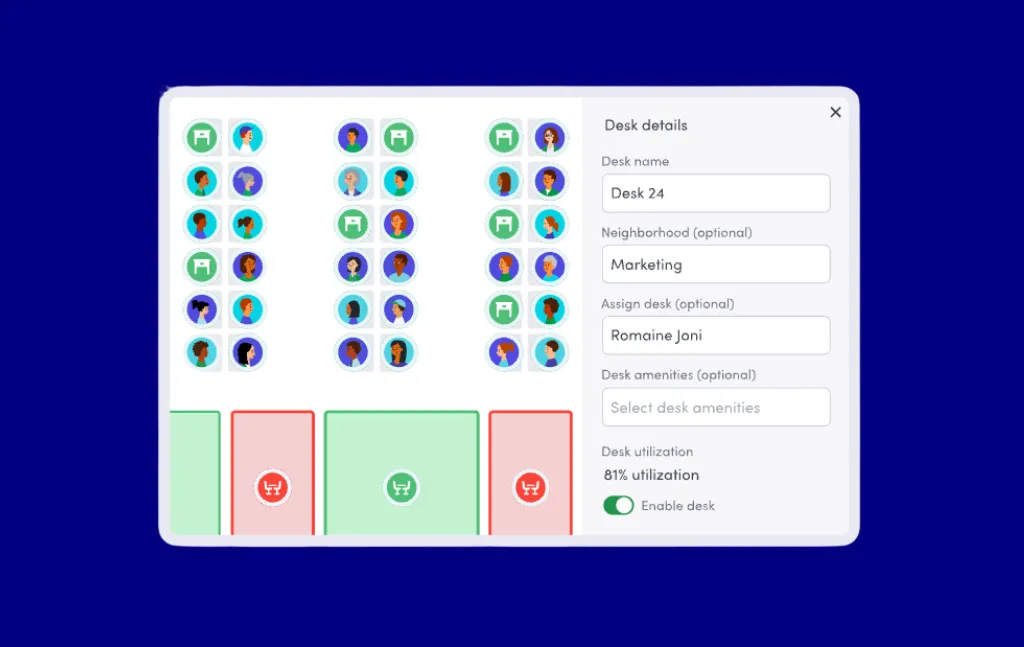
Interactive floor plans. A real-time visual map of your office—showing which desks and rooms are available, who’s sitting where, and how the floor is configured—dramatically increases booking adoption. Employees actually use a system when they can see their teammates and navigate visually. Look for interactive floor plans that support drag-and-drop booking, live occupancy overlays, and the ability to build or upload your floor plan without requiring CAD files or IT work.
Calendar integration quality. Two-way sync with Microsoft 365 or Google Workspace is non-negotiable for most organizations. One-way sync creates booking conflicts; two-way sync means a desk booked in Skedda shows up in Outlook and vice versa. Verify the sync granularity (15-minute intervals are standard) and whether the integration requires admin setup or individual user configuration.
Utilization analytics. Reporting should tell you: which spaces are used most and least, peak days and times, no-show rates, and how utilization trends over time. The most useful platforms surface this data without requiring a BI export, though export capability is valuable for organizations doing deeper analysis. This is the feature that justifies the budget to leadership.
Occupancy detection. Booking data and actual occupancy are different things: someone can book a desk and never show up. Look for platforms with passive occupancy detection: WiFi sensing, QR code check-in, IP address detection, or sensor integration. Auto-releasing unused bookings prevents ghost reservations and makes space utilization data trustworthy.
SSO and user provisioning. For any organization with 50+ employees, SAML SSO and SCIM provisioning are practical requirements, not luxury features. SCIM automatically adds and removes user profiles in your space management system using an external employee directory (like an IdP or HRIS system) as a single source of truth. This eliminates manual user management across multiple systems when someone joins or leaves your organization. Check whether SSO/SCIM is in the base plan or locked behind an enterprise tier.
Mobile booking experience. If employees can’t book a desk from their phone in two taps, they’ll stop using the system. The mobile experience is where adoption lives or dies. Look for native iOS and Android apps, not a mobile-responsive web view.
Pricing model fit. Discussed in depth in the pricing section below, but worth noting here: the pricing model (per user, per resource, or flat-rate) is a feature decision as much as a cost decision. Per-resource pricing means you can grow headcount without growing your software bill, a material advantage for organizations with hybrid work ratios above 1.5 employees per desk.
The “AI” label is applied liberally in this category right now. Most implementations are one of three things: (1) smart scheduling recommendations based on booking history, (2) natural language booking interfaces, or (3) predictive space suggestions. Robin has invested most heavily in AI-assisted scheduling. Kadence offers team-day coordination features that use pattern matching to suggest when teammates are likely to be in. Real LLM-based natural language booking remains rare.
The honest caveat: for most organizations in 2026, AI features are a nice-to-have rather than a decision driver. The platforms that execute governance, floor plans, and integrations well are more valuable than the ones with the slickest AI demo. Verify which “AI” features are in your plan tier before they become a purchasing rationale.
Ranked below. Skedda (the publisher) is #1 against the criteria in the methodology above; platforms #2–#6 are ordered by their public G2 ratings, and the remaining platforms follow. All competitor reviews are written independently of Skedda’s commercial interests.
Best overall. Skedda is our #1 pick for mid-market hybrid organizations that need deep booking governance and interactive floor plans without the cost or complexity of a full enterprise IWMS. As the publisher of this guide, we hold Skedda to the same rubric as every other platform and disclose its genuine limitations in the cons section below — see the methodology above.
Skedda is a workspace operations platform for organizations managing desks, meeting rooms, and other shared spaces, trusted by 8,000+ organizations and 3M users across finance, education, healthcare, professional services, and more.
Best for: Mid-market organizations (roughly 100–2,000 employees) that need deep booking governance (customizable rules, floor plans, and utilization analytics) without the implementation overhead of a full enterprise IWMS.
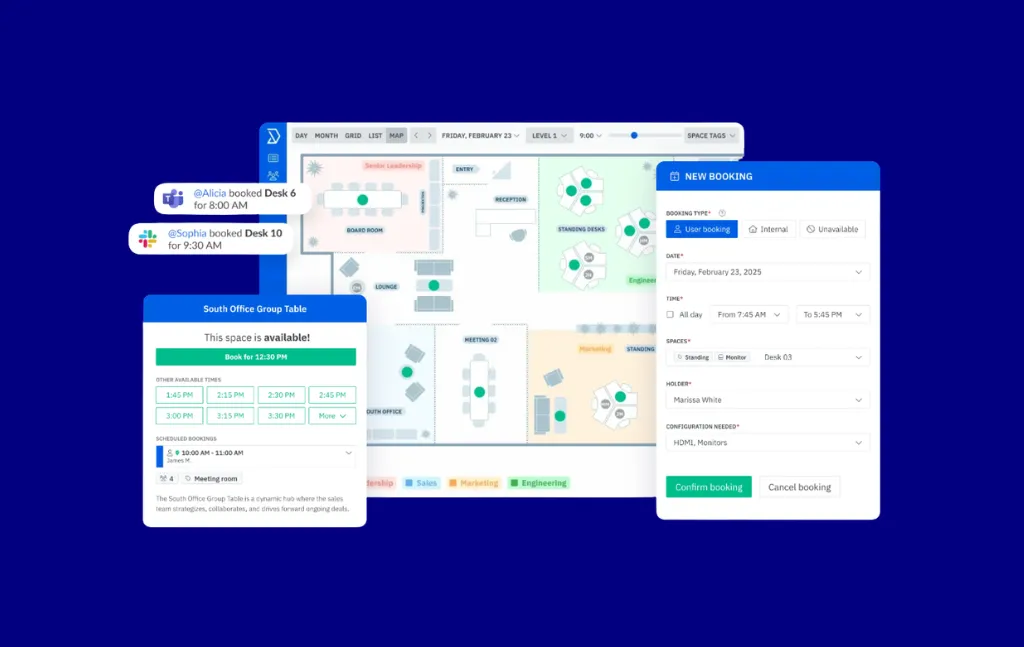
The most consistent feedback we hear from customers who switched from other tools is that they needed a platform powerful enough to enforce complex booking policies (zone restrictions, team quotas, manager approvals, buffer windows) but simple enough that employees would actually use it without hand-holding. That’s the core design tension Skedda is built around.
What stands out in practice: the booking rules engine is unusually deep for a tool at this price point. You can define who books what, when, and under what conditions without writing a single line of code. Cornell College’s Events and Facilities team summed it up: “Skedda has restored order to the building. Even on our busiest days… not once did I have to worry about someone being in the wrong room at the wrong time.”
The per-space pricing model also reflects a deliberate choice. Hybrid organizations have more employees than desks, so paying per user means your software bill scales with headcount regardless of how often people come in. Per-space pricing scales with your real estate footprint, not your employee count.
Integrations: Microsoft 365, Google Workspace, Microsoft Teams (native app), Slack, SAML SSO, Google, Microsoft Entra ID, Okta, ADFS, OneLogin, JumpCloud, SCIM (via Microsoft Entra ID and Okta), Zapier (outbound only)
See skedda.com/pricing for a full breakdown.
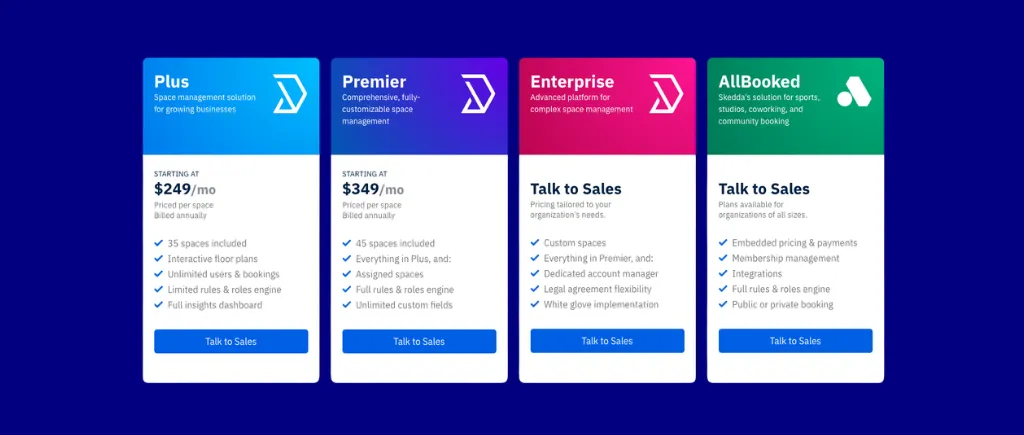
Bottom line: Skedda is the right choice for organizations that need a powerful booking governance engine, interactive floor plans, a native app within MS Teams, and strong utilization analytics, without the cost or complexity of an enterprise IWMS. The per-space pricing model makes it especially competitive for mid-market hybrid organizations where employees outnumber desks by a wide margin. If you need full facilities work order management or are managing 5,000+ employees across 20+ international sites, look at the enterprise options lower in this list.
See how Skedda fits your scenario
OfficeSpace Software is an upper-mid-market to enterprise workplace management platform that covers desk booking, room booking, and space planning under one roof. It sits between the simpler booking tools and the full IWMS platforms in scope and complexity.
Best for: Mid-market and enterprise facilities teams that need space planning capabilities (move management, stack planning, what-if scenario modeling) alongside day-to-day desk and room booking.
OfficeSpace holds the highest public G2 rating of the platforms with a comparable score (4.7/5), and it has been consistently building out its space planning capabilities. It now offers a credible alternative to full IWMS platforms for organizations that need more than booking but don’t want the implementation weight of FM:Systems or Archibus. The help desk / service request module is also a differentiator for facilities teams managing reactive maintenance requests within the same platform.
Integrations: Microsoft 365, Google Workspace, Azure AD/Entra ID, HRIS systems, Slack
OfficeSpace does not publish pricing publicly. Expect enterprise procurement timelines.
Bottom line: OfficeSpace Software is a strong choice for mid-enterprise facilities teams that need space planning alongside booking. If you need move management, what-if scenario planning, or service requests, OfficeSpace is worth a detailed evaluation. If you primarily need booking governance and utilization analytics, a leaner platform will cost less and deploy faster.
Officely is a Slack-native (and now Microsoft Teams-compatible) desk booking tool built from the ground up for small-to-mid hybrid teams. It lives entirely inside Slack, with no separate app to log in to.
Best for: Small-to-mid hybrid teams (typically under 200 employees) whose entire workflow already lives in Slack.
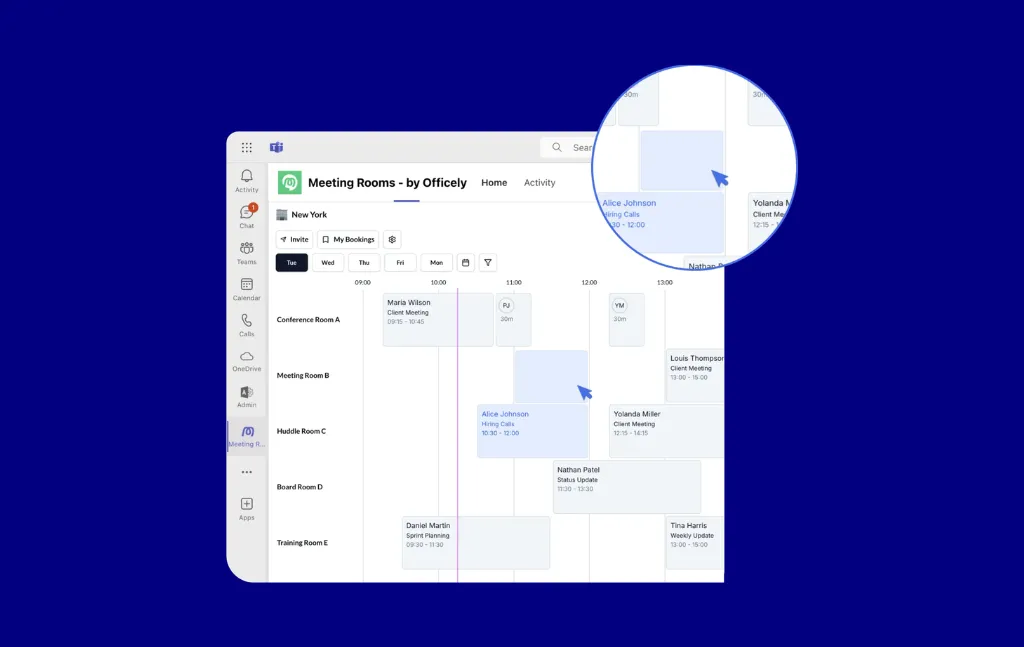
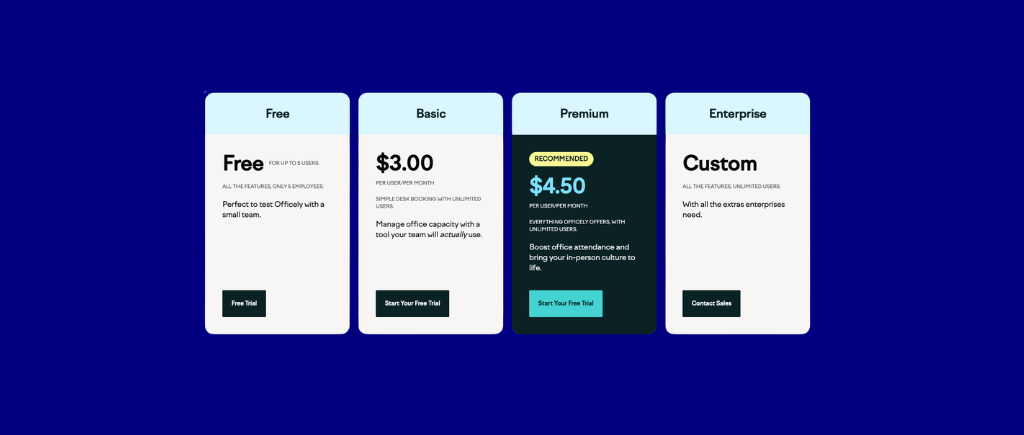
Officely makes a specific bet: the best booking tool is one employees never have to think about because it’s already where they spend their day. The adoption story is compelling for small teams: the free tier is genuinely functional and paid plans remain affordable. G2 reviewers (4.6/5) consistently highlight how fast they got up and running.
Integrations: Slack (native), Microsoft Teams, Google Workspace, Microsoft 365, HRIS (via Slack)
Officely has a functional free tier, worth testing before committing to a paid plan.
Bottom line: Officely is the right tool for small hybrid teams who want a simple, zero-friction way to book desks and coordinate office days in Slack. It’s not the right tool for organizations with complex governance requirements, multi-location deployments, or utilization analytics as a priority.
Tribeloo is a European hybrid workplace management platform that covers desk booking, room booking, and team coordination. It’s lighter than full enterprise platforms but more fully featured than SMB tools like Officely.
Best for: European mid-market organizations (roughly 50–500 employees) that want fast setup, clean UX, and hybrid work coordination without enterprise complexity.
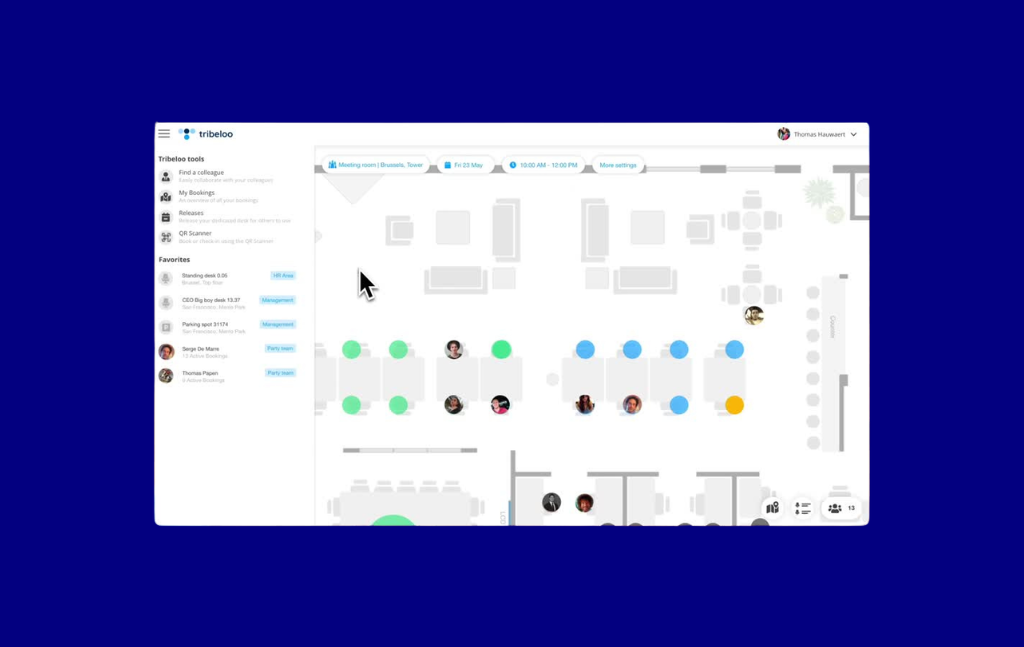
Tribeloo earns its place through a combination of clean implementation experience and solid coverage across desk and room booking, floor plans, and hybrid attendance features (4.6/5 on G2). Reviewers consistently cite quick setup and responsive support. For European organizations looking for a local vendor with GDPR-first infrastructure, it’s a credible alternative to US-headquartered platforms.
Integrations: Microsoft 365, Google Workspace, Slack, Teams, HRIS via API
Tribeloo pricing is in EUR; verify USD equivalent and current plans from tribeloo.
.png)
Bottom line: Tribeloo is a solid mid-market choice for European organizations that want clean UX, fast setup, and reasonable pricing without enterprise complexity. For NAM organizations or buyers with complex governance requirements, the regional focus and booking rules limitations are worth weighing carefully.
WorkInSync is a workplace management platform built for enterprise hybrid work management, with particular strength in organizations managing large, distributed workforces across global locations.
Best for: Global enterprises managing hybrid attendance compliance, multi-location deployments, and complex workforce coordination across time zones.
WorkInSync’s differentiating strength is hybrid workforce management at scale: attendance enforcement, hybrid schedule compliance tracking, cafeteria booking, shuttle booking, and parking management, covering the full suite of workplace services beyond just desks and rooms (4.5/5 on G2). For global enterprises managing hybrid mandates across thousands of employees in multiple countries, this breadth is genuinely useful.
Integrations: Microsoft 365, Google Workspace, Teams, Slack, HRIS (SAP, Workday, BambooHR, others)
Bottom line: WorkInSync makes sense for global enterprises that need a single platform covering the full hybrid employee experience: not just desks and rooms, but the entire suite of workplace services. For organizations primarily focused on desk and room booking governance, a more focused platform will deploy faster and perform better on core use cases.
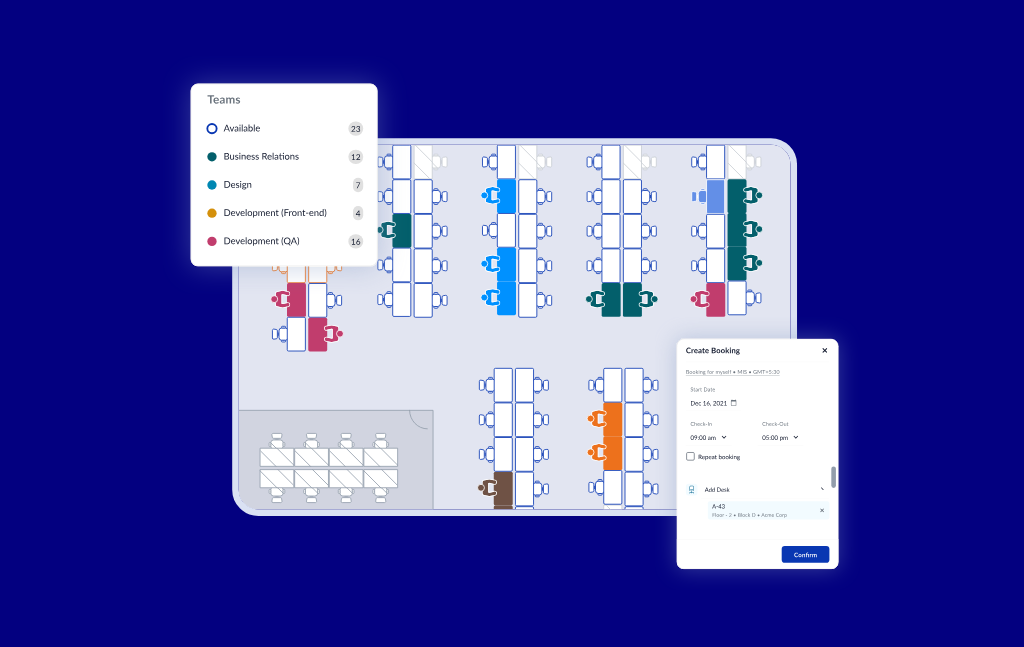
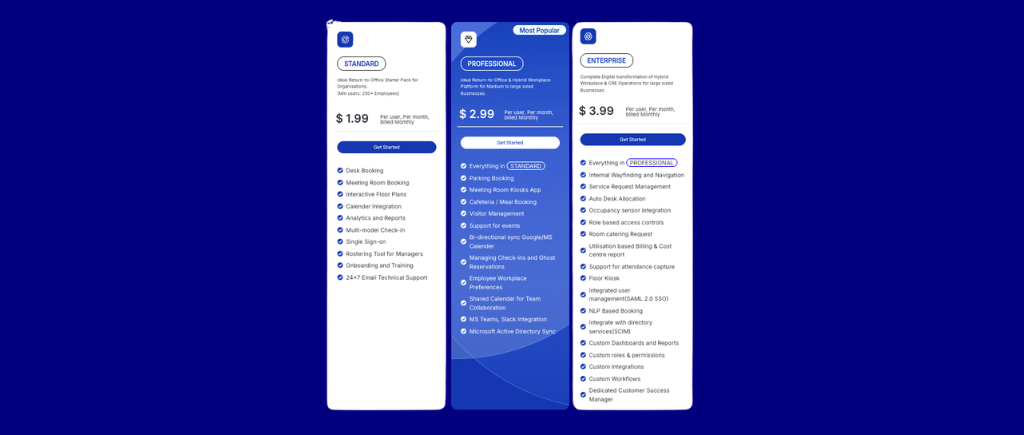
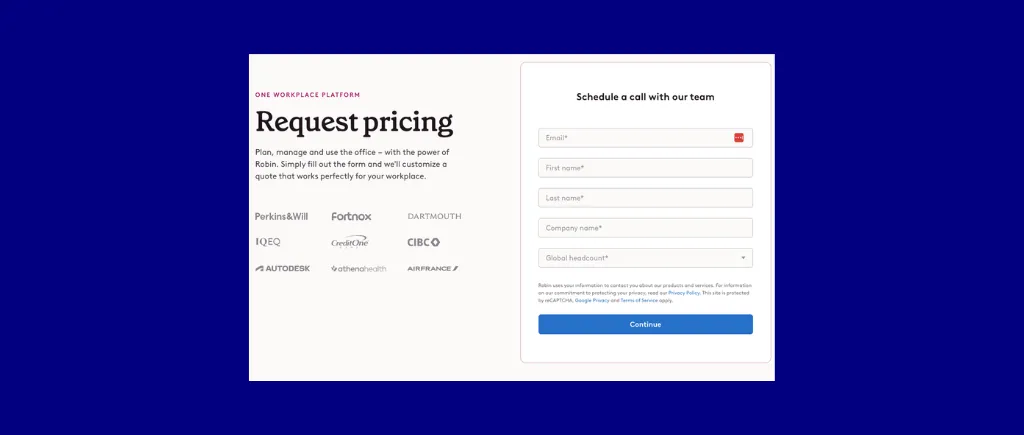
Robin is a workplace experience platform targeting mid-market and enterprise organizations. It has invested heavily in AI-assisted scheduling and analytics, and its 200M+ bookings processed gives it one of the largest behavioral data sets in the category.
Best for: Mid-market to enterprise organizations prioritizing AI-powered workplace scheduling, visitor management, and a premium in-office experience.
Robin’s AI scheduling features are the most developed in this category: natural language meeting room booking, smart suggestions based on team attendance patterns, and AI-driven no-show detection (4.4/5 on G2). If workplace analytics are a strategic priority (not just utilization reporting, but predictive modeling of how space demand will evolve), Robin’s data advantage is real.
Integrations: Microsoft 365, Google Workspace, Slack, Teams, Zoom, Okta, access control hardware
Robin does not publish pricing publicly. Budget at least $5–8/user/month for mid-tier plans based on market data. Verify with Robin directly.
Bottom line: Robin is the right choice for organizations where AI-powered scheduling and workplace experience are genuine strategic priorities, and where the budget reflects that. For organizations primarily solving booking fairness and space visibility, the cost-to-value ratio of per-space priced alternatives is likely more favorable.
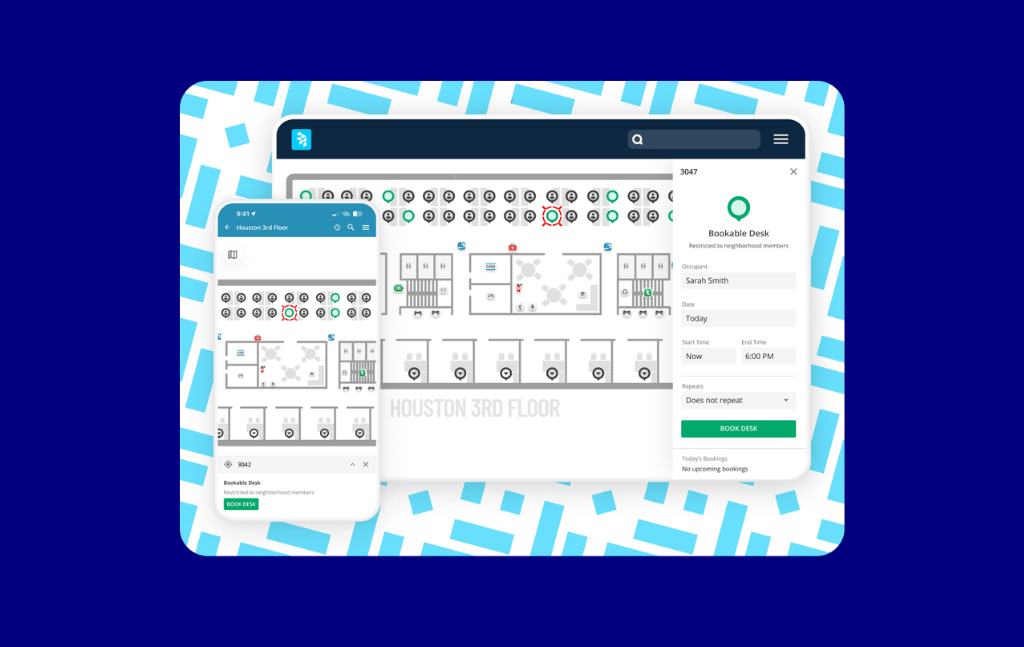
Archie is a workspace management platform built for both coworking operators and corporate hybrid offices, one of the few tools in this category that serves both markets credibly.
Best for: Coworking spaces and hybrid corporate offices that want per-resource pricing, visitor management, and meeting room + desk booking in a single platform.
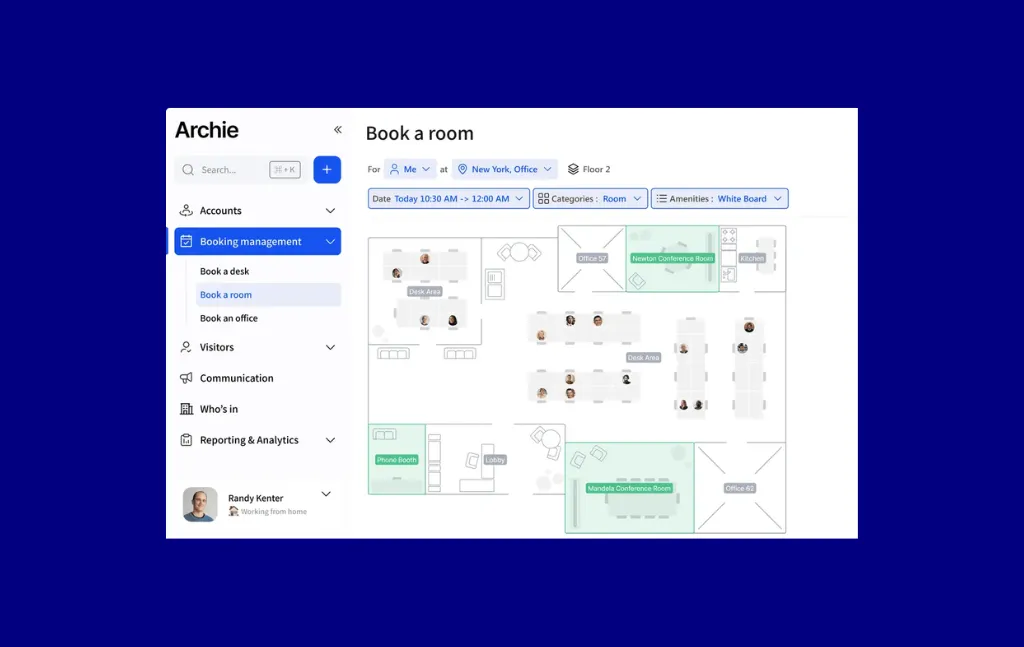
Archie earns its place on this list for two reasons: it’s one of the few alternatives to Skedda using per-resource pricing (making it directly comparable on total cost), and its coworking feature set is strong enough to handle external member billing and access management, a use case most workplace tools don’t support. G2 reviewers consistently cite its clean interface and fast implementation as standout qualities.
Integrations: Microsoft 365, Google Workspace, Slack, Stripe (for billing), access control systems
Archie’s pricing is per-resource, comparable to Skedda. Verify current figures before purchasing.
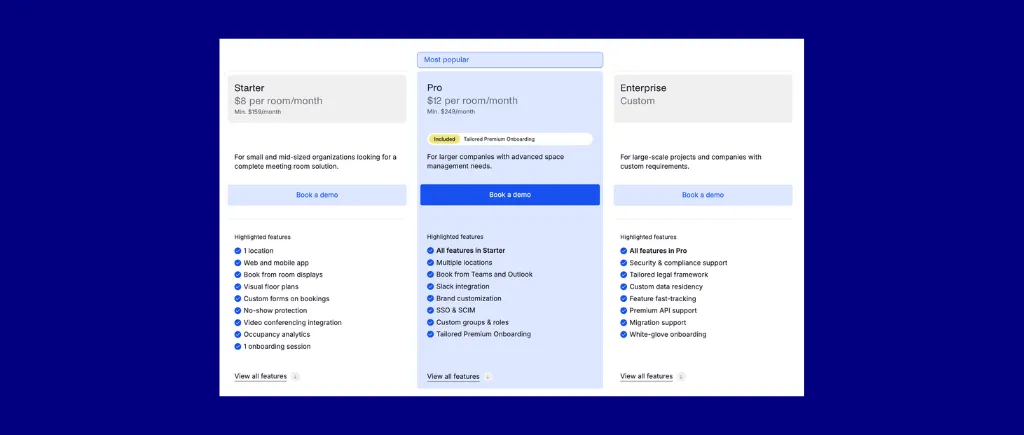
Bottom line: Archie is a strong option for organizations that want per-resource pricing, hybrid desk/room booking, and extensive coworking management features. If your policy governance requirements are complex (zone restrictions, department quotas, multi-condition rules), run a detailed feature comparison against Skedda before deciding.
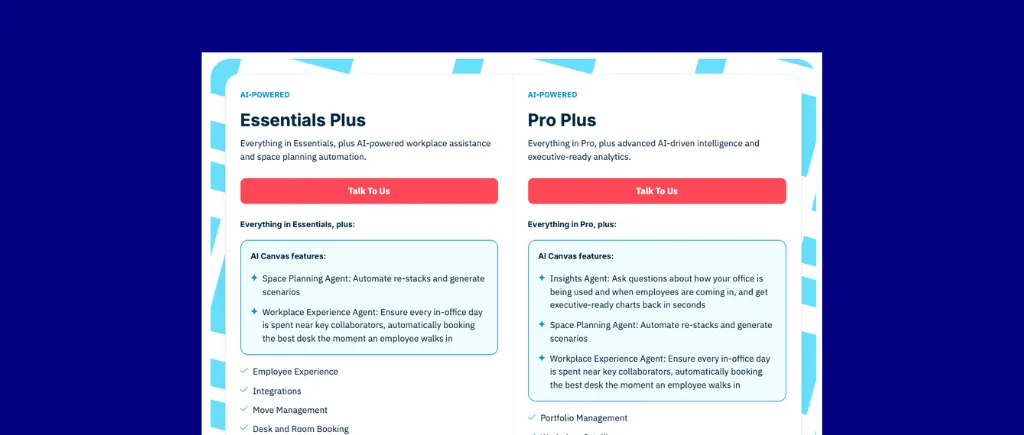
Condeco is an enterprise workspace management platform, now part of the Eptura group. It has a long history in large corporate environments and is particularly strong for organizations running Microsoft 365 as their primary productivity stack.
Best for: Enterprises with 2,000+ employees that need deep Microsoft 365 integration, multi-site management, and return-to-office attendance enforcement.
%20platform.webp)
Condeco’s strength is its breadth at enterprise scale: multi-building management, advanced check-in methods (kiosks, QR, NFC, mobile), AI Copilot for Microsoft Teams, and meeting room + desk booking under one umbrella. For organizations fully committed to the Microsoft stack (Outlook, Teams, Exchange), Condeco’s native integration depth is difficult to match.
Integrations: Microsoft 365 (deep), Outlook, Teams, Azure AD/Entra ID, access control hardware
Condeco does not publish pricing. Budget accordingly for enterprise procurement timelines.
%20pricing.webp)
Bottom line: Condeco is the right call for large enterprises (5,000+ employees) that live and breathe Microsoft 365 and need an enterprise-grade, multi-site management layer. If your organization is hybrid on Google Workspace and Microsoft, or if you’re under 1,000 employees, the implementation overhead and cost likely outweigh the benefits.
deskbird is a hybrid workplace management platform with a strong foothold in Europe and a differentiated HRIS integration strategy that sets it apart from most competitors in this category.
Best for: EMEA-based hybrid teams that want employee-first UX, team-day coordination, and deep HRIS connectivity without paying for features they won’t use.
What stands out about deskbird is the HRIS connectivity: through a Merge.dev integration, deskbird connects to 14+ HRIS systems for automated user provisioning, a meaningful advantage for HR-driven buyers who want the employee roster to stay in sync automatically. The mobile app and AI-powered desk recommendations are also consistently well-rated by G2 reviewers.
Integrations: Microsoft 365, Google Workspace, Slack, Teams, Merge.dev (HRIS aggregator, 14+ HRIS systems)
deskbird pricing is per user. SCIM is available but may require an upgrade. Verify before purchasing.
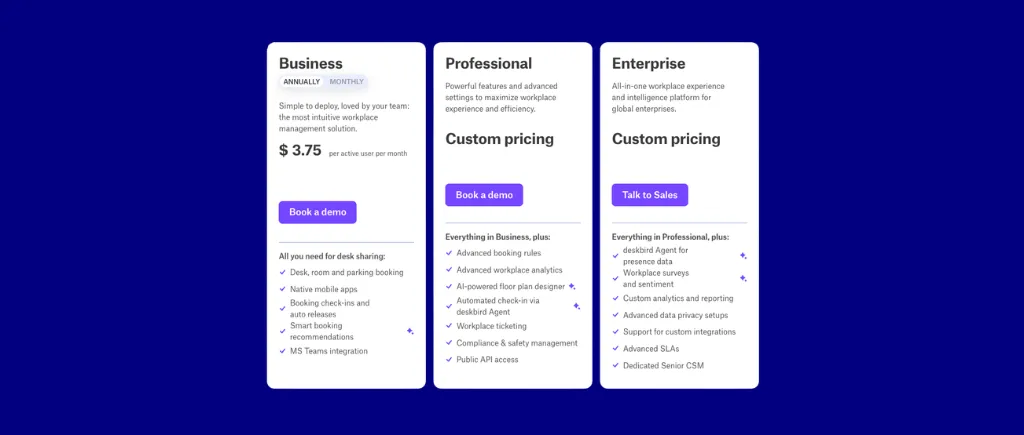
Bottom line: deskbird is a strong choice for European mid-market teams prioritizing employee experience and HRIS-connected user management. For NAM organizations or teams with complex booking governance requirements, run a direct feature comparison before committing.
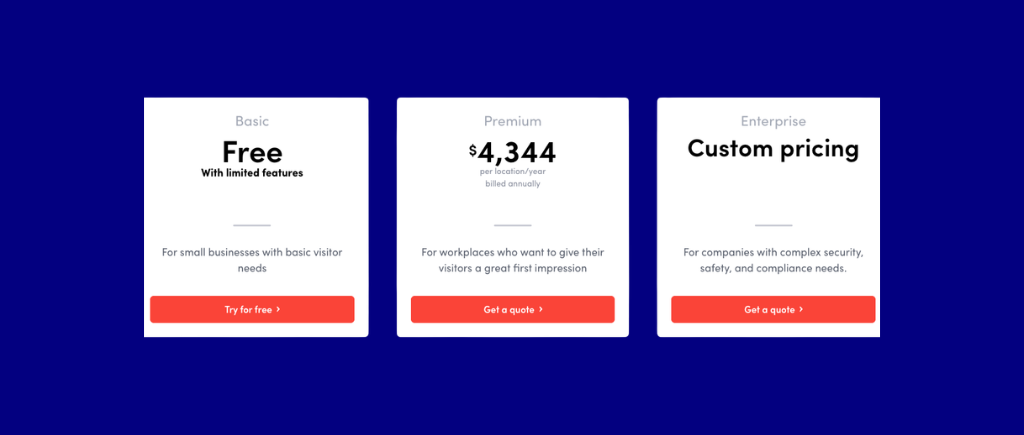
Envoy started as a visitor management platform and expanded into desk and room booking. Today it’s a dual-use platform: best when visitor management and employee workspace booking need to live in a single system.
Best for: Organizations where visitor experience takes priority over employee desk/room booking, but should still be managed in the same system.
Envoy’s visitor management is genuinely the best in the category: QR check-in, badge printing, health and safety screening, and regulatory compliance features. If visitor management is a hard requirement and you want it tightly integrated with desk and room booking, Envoy is the platform most likely to satisfy both without stitching together separate tools.
Integrations: Microsoft 365, Google Workspace, Slack, Teams, Okta, over 100 third-party integrations
Envoy pricing is not published. G2 reviewers note a mandatory platform fee on top of per-resource pricing. Request a fully loaded quote.
Bottom line: Envoy is the right call when visitor management is a core requirement alongside desk and room booking. If you primarily need internal workspace governance and utilization analytics, Envoy’s strength doesn’t align with what you’re solving for, and the cost is likely higher than alternatives.
FM:Systems is an enterprise Integrated Workplace Management System (IWMS) built and owned by Trimble. It’s a different category of product from the other tools on this list: wider in scope, more complex to implement, and built for organizations that need facilities management, space planning, and bookable resources in one platform.
.png)
Best for: Large enterprises that need a full IWMS: space planning, move management, maintenance work orders, and desk/room booking managed in a single system.
FM:Systems earns inclusion here because there’s a real buyer segment (typically corporate real estate and facilities leadership at organizations above 5,000 employees) where a point solution for booking and a separate IWMS creates data fragmentation. If your organization has a dedicated CAFM or IWMS initiative underway, FM:Systems should be in your evaluation.
Integrations: Microsoft 365, Google Workspace, Azure AD, CAD and BIM tools, HRIS systems, access control
FM:Systems is custom enterprise pricing. Full-scope deals typically involve multi-month procurement processes.
Bottom line: FM:Systems is the right tool when you need an enterprise IWMS and booking is one capability among many you’re purchasing. It’s not the right tool if you primarily need a well-adopted booking system with strong utilization data and no interest in the broader IWMS scope.
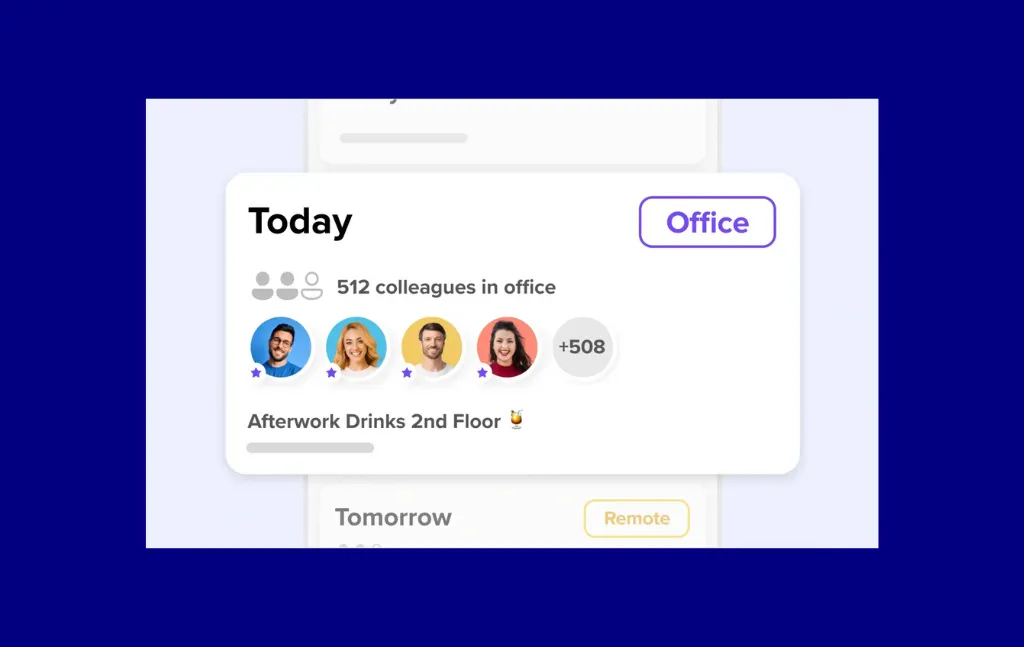
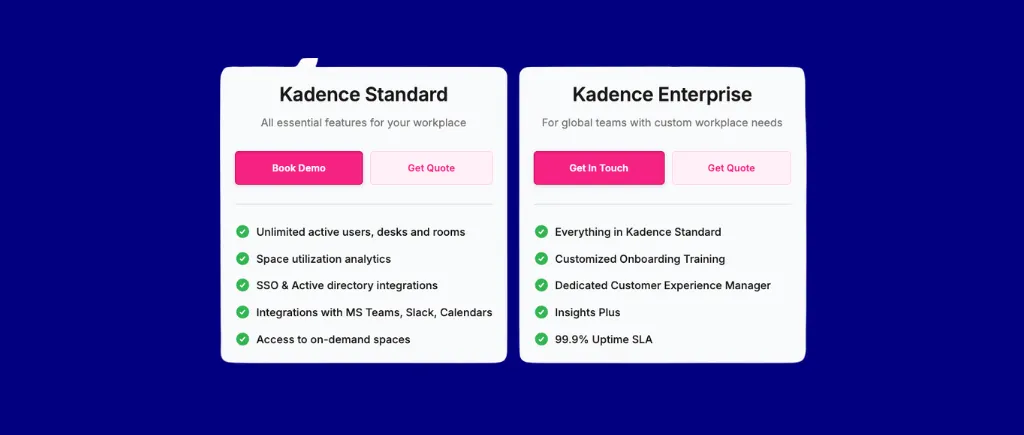
Kadence is a hybrid work platform that differentiates through a focus on user-friendly hybrid collaboration. Clear teammate booking schedules, events management, and workplace announcements make Kadence a great space management system for end-users and HR professionals concerned with maintaining hybrid policies.
Best for: Organizations where employee engagement and adoption are the primary initiatives and coordinating in-office days is essential.
The adoption argument for Kadence is genuine: if employees need a better way to know where and when their colleagues are booked in the office, Kadence is the easiest system to answer that question. Its AI-powered desk recommendations (suggesting seats based on which teammates are expected in) also address the “I don’t know if it’s worth coming in” problem that’s common in hybrid environments.
Integrations: Microsoft Teams (native app), Slack (native app), Microsoft 365, Google Workspace, HRIS tools
Verify current pricing from Kadence.
Bottom line: Kadence is the strongest option if visualizing and coordinating in-office schedules is central to how your team works. If your policy governance requirements are complex, or if you’re primarily optimizing for real estate cost decisions, look at platforms with deeper rules engines and occupancy tracking.
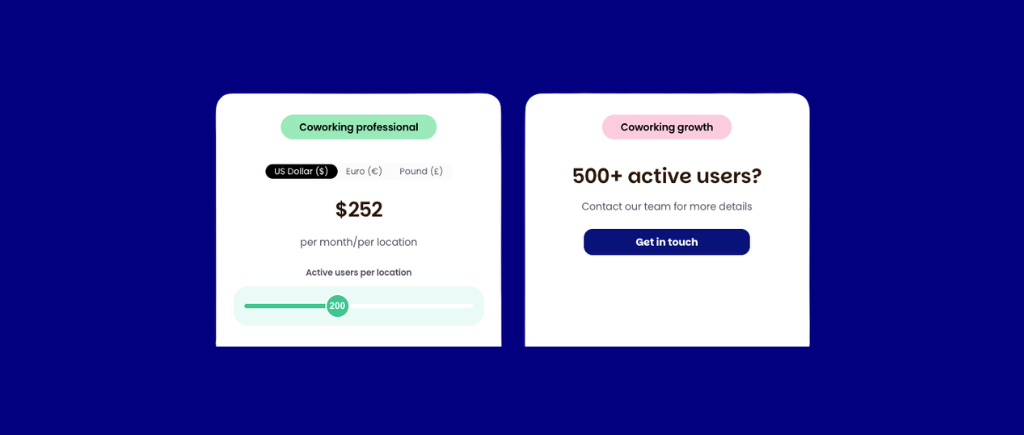
Nexudus is purpose-built for coworking and flex space operators, managing external member communities rather than (or in addition to) internal employees. It’s a different use case from most platforms on this list, included here because it’s the strongest tool for that specific buyer.
Best for: Coworking space operators, flex space managers, and corporate teams that need to manage external member access, billing, and community features alongside internal booking.
.png)
Nexudus handles the coworking use case more completely than any other platform in this category: member onboarding, recurring billing, café ordering, event management, community features, and access control are all integrated. For a coworking operator, trying to piece together a booking tool, billing system, and community platform separately costs more and adds operational overhead.
Integrations: Stripe (billing), Kisi, Salto, Brivo (access control), Microsoft 365, Google Workspace, Zapier
Nexudus pricing is flat-rate by member tier. Verify current plans from nexudus.
Bottom line: Nexudus is the right tool if you’re operating a coworking space or flex office for external members. For internal corporate workplace management, the feature set doesn’t map to your requirements. Look at the other platforms on this list.
These platforms didn’t make the main list either due to scope overlap, narrower market fit, or less public information available to review fairly. Each is worth investigating if your situation fits:
This is the decision that most directly affects your total cost of ownership, and most buyers don’t run the math before shortlisting.
Per-user pricing means you pay for every employee who could book a space, regardless of how often they come in. Cost scales directly with headcount. For a fully in-office organization, this model is predictable. For a hybrid organization where employees share desks, it means you’re paying for 300 seats when 150 desks exist.
Per-resource pricing means you pay for each bookable space (desk, room, locker, parking spot). Adding employees doesn’t change your bill. For hybrid organizations with a desk-sharing ratio above 1.5 employees per desk, this is materially cheaper, and the gap widens as headcount grows while desk count stays fixed.
Flat-rate tier pricing sets a fixed monthly fee for a defined scope. Predictable, but may constrain flexibility as you grow.
Run this calculation before shortlisting: Take your total employee count and your total bookable desk count. If employees outnumber desks (a 2:1 ratio is common in hybrid offices), per-resource pricing platforms are worth a focused look.
The biggest cause of post-purchase regret in this category is discovering that an integration doesn’t work the way you expected after signing. Before engaging any vendor:
Verify integration depth in a hands-on trial, not a demo. “Integrates with Microsoft 365” can mean anything from a true bidirectional calendar sync to a simple webhook.
Not all organizations need deep booking rules. But if you have any of the following requirements, confirm the platform handles them natively before moving forward:
If your current “policy” lives in a shared document that admins enforce manually, you need a platform with governance depth, not just a booking calendar.
There’s a meaningful difference between a platform with a 14-day self-serve trial and one that requires a 3-month enterprise onboarding project. Both are appropriate for different contexts, but be honest about which your organization actually needs and is resourced to execute.
Self-serve platforms (Skedda, Archie, deskbird, Officely) typically get to first booking within a day. Enterprise platforms (Condeco, FM:Systems, OfficeSpace Software) typically involve implementation projects, data migration, and IT involvement. Neither is better; they’re right for different organizations.
Screenshot this and bring it to your first vendor demo.
Per user: You pay for every employee who could book. Cost scales with headcount. Common at: Robin, Envoy, OfficeSpace Software, deskbird, Kadence, Condeco.
Per resource: You pay for each bookable desk, room, or space. Adding employees doesn’t increase cost. Common at: Skedda, Archie.
Flat-rate tier: Fixed monthly fee for a defined scope. Common at: Nexudus (coworking).
In a hybrid office where employees share desks, per-resource pricing is materially cheaper than per-user. An organization with 300 employees and 150 desks pays for 300 seats under per-user models versus 150 spaces under per-resource models. The gap grows as headcount scales while desk count stays fixed.
AI is arriving, but unevenly. Natural language booking and AI desk recommendations are real features today in a handful of platforms (Robin, Kadence, deskbird). Most “AI” in this category is pattern matching and rule-based automation, useful but not transformative. Watch this space over the next 12–18 months as LLM-based features mature.
Real occupancy data is becoming the differentiator. The shift from “booking data” to “actual occupancy data” is accelerating. WiFi sensing, badge readers, and desk sensors are making it possible to know whether booked spaces are actually used, enabling auto-release of ghost bookings and making utilization reports trustworthy. Platforms investing in passive occupancy detection are ahead of where the market is heading.
Per-space pricing models are gaining ground. As organizations sharpen focus on hybrid real estate cost optimization, the structural advantage of per-resource pricing over per-user is becoming more visible in RFPs. Expect more platforms to offer resource-based pricing tiers in 2026–2027.
Return-to-office compliance is driving attendance management features. Organizations with hybrid mandates (3 days/week, minimum attendance requirements) are increasingly looking for software that enforces and reports on compliance, not just enables booking. Platforms with built-in attendance tracking and manager reporting are seeing stronger demand from HR and compliance-driven buyers.
Microsoft 365 integration depth is a table-stakes evaluation criterion. Two-way calendar sync was the baseline. Now buyers are asking about Teams-native booking apps, Outlook room finder integration, and Exchange Online compatibility. Platforms without credible M365 integration are being filtered out early.
What’s the difference between space management software and facilities management software?
Space management software focuses on how spaces are booked, governed, and measured: who can book what, when, under what rules, and how often spaces are used. Facilities management software is broader: it typically includes maintenance work orders, asset management, lease management, and HVAC/energy management. Many platforms in this guide are space management tools; FM:Systems and OfficeSpace Software sit closer to the FM end of the spectrum. If you need maintenance ticketing and move management alongside booking, you need a fuller FM platform.
What pricing model is most cost-effective for hybrid offices?
Per-resource pricing is generally cheaper when employees outnumber desks. If your organization has 250 employees sharing 100 desks (a 2.5:1 ratio, common in hybrid environments), you’d pay per-user platforms for 250 seats versus paying per-resource platforms for 100 spaces. The math compounds quickly: at $4/user/month, 250 users costs $1,000/month. At $5/space/month, 100 spaces costs $500/month. Run your own numbers; your headcount-to-desk ratio drives the answer.
Do I need separate software for desk booking and room booking?
No, virtually all platforms reviewed here handle both. The more important question is whether meeting room booking is included in your base plan or is a separate add-on. Confirm this upfront.
How do I evaluate a vendor that doesn’t publish pricing?
Build a complete requirements list before engaging: number of desks, number of meeting rooms, number of locations, total employee count, required integrations, whether you need SSO/SCIM, whether visitor management is in scope. Submit this as a formal RFP or structured email to each opaque vendor and ask for a fully loaded quote, including platform fees, add-ons, and onboarding costs. Then compare against the published-pricing vendors for an apples-to-apples view.
What analytics should space management software provide at minimum?
The baseline: desk utilization rates by day and week, peak occupancy days, no-show rates (booked-but-not-used), and room utilization by type. Meaningful baseline: occupancy tracking, department-level utilization breakdowns, trend data over 90+ days, and exportable data for your own analysis. Advanced: predictive demand modeling, collaboration pattern analysis, and real-time occupancy overlays on floor plans. Most platforms on this list cover the baseline; a subset cover the meaningful baseline; very few hit advanced.
What’s the difference between hot desking and office hoteling?
Hot desking is first-come, first-served: employees arrive and take any available desk, no reservation required. Office hoteling means employees reserve a specific desk or workspace in advance, like booking a hotel room. Most modern platforms support both models, often configurable by zone. The distinction matters for your booking rules: if you want teams to coordinate which days they’re in and sit near each other, hoteling (advance reservation) is the right model.
Which tools have free plans suitable for piloting?
Skedda offers a 14-day free trial (no credit card required). Officely has a functional free tier up to 40 users. Most enterprise-focused platforms (Condeco, FM:Systems, OfficeSpace Software, Robin, WorkInSync) are demo-required with no self-serve trial. Kadence and deskbird offer free trials with time limits.
Space management is ultimately an operational problem, and the right software is the one your team will actually use. Not the one with the most features, the best demo, or the lowest headline price.
Start with your pricing model calculation (headcount vs. desk count), confirm your calendar integration requirement, and shortlist two or three platforms with a free trial or self-serve option. Get your IT, HR, and facilities teams aligned on must-have governance features before the vendor conversations begin.
If Skedda fits your scenario (mid-market org, governance-heavy requirements, or per-space pricing makes the math work), we’re happy to walk through your specific setup.
Data sources: G2 ratings are approximate as of April 2026; verify at g2.com. Competitor pricing drawn from publicly available vendor data and third-party research as of April 2026; verify directly with vendors. JLL utilization data: JLL Future of Work research.
Skedda is the publisher of this guide. Skedda ranks itself #1 based on the transparent criteria described in the methodology above; Skedda’s limitations are disclosed openly in its cons section, and all competitive reviews are written independently.
Our team is ready and waiting to talk through your specific desk scheduling requirements and see how Skedda could work for you.