
Webinar On-Demand:
Is Anyone Actually in the Office? A Modern Guide to Occupancy Tracking

Identifique y acceda a 2 o 3 fuentes de datos principales. Los datos de credenciales y los sistemas de reservas son el punto de partida más sencillo para la mayoría de las organizaciones. Utilice el Hoja de cálculo de inventario de datos para trazar un mapa de lo que existe y con quién contactar. Programe reuniones con los propietarios de los datos. Solicite datos históricos de 3 a 6 meses para establecer patrones de referencia. Documente lo que reciba, incluidos los períodos de tiempo, las limitaciones conocidas y las definiciones de datos.
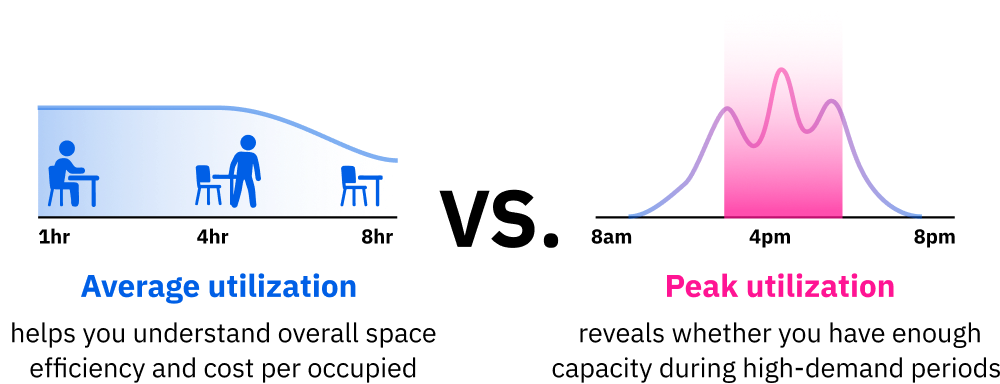
Calcule sus métricas de utilización: utilización promedio, utilización máxima y costo por puesto ocupado. Cree visualizaciones del día de la semana y de la hora del día. Desglose la utilización por departamento, planta o edificio si tiene datos de varios sitios. Busque patrones, anomalías y señales de alerta. Valide sus hallazgos comparando diferentes fuentes de datos (por ejemplo, ¿los datos de los sensores coinciden con los datos de los sensores al pasar la insignia? ¿Las reservas coinciden con la ocupación real?) Documente su metodología para que el análisis pueda repetirse.
En función de su análisis, identifique de 3 a 5 recomendaciones prácticas específicas. Priorice las ganancias rápidas que requieren una inversión mínima y pueden demostrar su valor rápidamente. Por ejemplo, puede empezar calculando su tasa de utilización del espacio para ver con qué frecuencia y con qué intensidad se utilizan realmente los espacios, y si hay oportunidades para optimizarlos. Para cada recomendación, calcule el impacto financiero, los requisitos de recursos, el cronograma de implementación y los riesgos potenciales. Desarrolle su presentación ejecutiva sobre el ROI. Antes de presentárselos a los directivos, pídele a un colega o a una parte interesada de confianza que te dé su opinión sobre tus conclusiones.

Programa una presentación con los principales responsables de la toma de decisiones. Presente sus hallazgos de manera clara y concisa, centrándose en el impacto financiero y en las recomendaciones prácticas. Utilice nuestro Hoja de referencia sobre el ROI para ayudarlo a traducir el valor de sus fuentes de datos y crear un modelo de negocio para sus objetivos. Obtenga la aprobación para pilotar de 1 a 2 triunfos rápidos. Implemente los cambios y establezca métricas para hacer un seguimiento del impacto. Planifique un registro de 30 o 90 días para revisar los resultados. Documente las lecciones aprendidas y utilícelas para perfeccionar su enfoque para el siguiente ciclo de análisis.
Cómo crear tu primera presentación ejecutiva
Tome su análisis y destile en un Presentación ejecutiva sobre el ROI. Si corresponde, incluya su tasa de utilización promedio, la tasa de utilización máxima, los pies cuadrados totales, el costo por pie cuadrado, el costo por asiento ocupado y la ocupación por día de la semana. Calcula la oportunidad.
Por ejemplo, si su uso promedio es del 45%, está pagando por más del doble del espacio que necesita. A 50 dólares por pie cuadrado, una oficina de 50 000 pies cuadrados cuesta 2,5 millones de dólares al año. Si pudiera ajustar el tamaño a sus necesidades reales, ahorraría más de 1 millón de dólares. Este análisis se convierte en el punto de partida de su conversación con el liderazgo.
Nuestro equipo está listo y esperando para analizar tus requisitos específicos de programación de escritorio y ver cómo Skedda podría ayudarte.
En el Hoja de cálculo de inventario de datos, se le otorga un nivel de madurez de datos una vez que haya terminado de evaluar todas sus fuentes de datos. Esto proporciona un marco para calificar el uso actual de las fuentes de datos a fin de impulsar las decisiones empresariales.
Ha dado el primer paso hacia la administración del espacio basada en datos. A medida que genere confianza y demuestre valor, puede ampliar su análisis para incluir fuentes de datos adicionales, técnicas más sofisticadas y un impacto organizacional más amplio.
La clave es empezar de forma sencilla, mostrar los resultados e iterar. Cada análisis le enseña algo nuevo sobre sus datos, sus espacios y su organización. Con el tiempo, obtendrá una imagen completa de cómo funciona realmente su lugar de trabajo y dispondrá de los datos para demostrarlo.
Usa esta guía como base, pero no te detengas aquí. Cuanto más trabajes con tus datos, más preguntas podrás responder y más valor generarás para tu organización.